Find & Replace Partial Strings

I recently had a request to remove part of a text field from MySQL, JSON data but stored as text in MySQL 5.6.

Has this been Mongo, this could have been a pretty quick update of the data within an array:

  1. Find the data

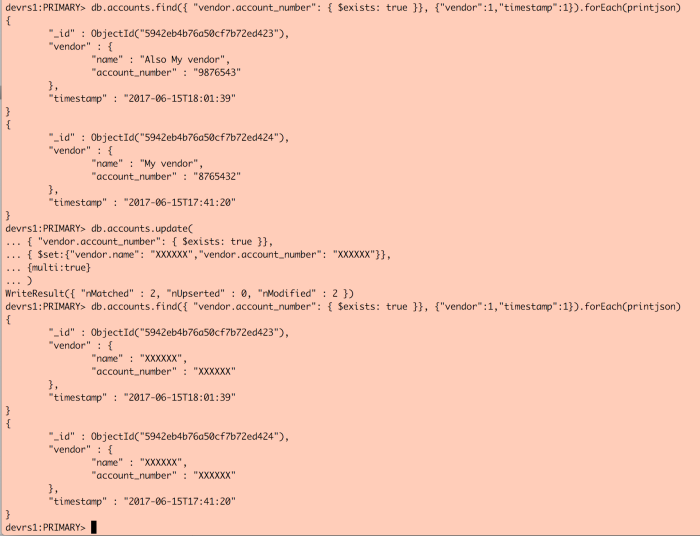
    db.accounts.find({ “vendor.account_number”: { $exists: true }}, {“vendor”:1,”timestamp”:1}).forEach(printjson)

  2. Update the data

    db.accounts.update(
    { “vendor.account_number”: { $exists: true }},
    { $set:{“vendor.name”: “XXXXXX”,”vendor.account_number”: “XXXXXX”}}, {multi:true}
    )

  3. Screen Shot 2017-06-15 at 4.18.16 PM

On  MySQL, this was a bit trickier. I was able to pull out the segment to be updated using SUBSTRING.  Once I was able to identify the SUBSTRING values, I used REPLACE with SUBSTRING_INDEX for the substitution “from” values.

  • SUBSTRING_INDEX Syntax: SUBSTRING_INDEX(str,delim,count)
    • My data had variable length fields, but were consistent on the prefix for the data, and the character immediately at the end of the section:
    • SUBSTRING_INDEX(request, ‘”vendor”:{“name”:”‘, -1)
      • str = request (my column)
      • delim = “vendor”:{“name”:”‘  — name was potentially used in more locations, so the longer string
      • count = -1
        • “If count is positive, everything to the left of the final delimiter (counting from the left) is returned. If count is negative, everything to the right of the final delimiter (counting from the right) is returned”

  • REPLACE Syntax: REPLACE(str,from_str,to_str)
    • Since my data varied on each record, I had to create a new “from string” to match.  I set the update on the same column twice as I was running multiple modifications.
      • REPLACE(request, SUBSTRING_INDEX(SUBSTRING_INDEX(request, ‘”vendor”:{“name”:”‘, -1),'”,’,1), ‘XXXXXXXX’)
        • str = request — my column
        • from_str = SUBSTRING_INDEX(SUBSTRING_INDEX(request, ‘”vendor”:{“name”:”‘, -1),'”,’,1) — my string subsection, variable by row
        • to_str = ‘XXXXXXXX’ — my replacement/”to” value
  1. Find the data

    SELECT id
    , SUBSTRING_INDEX(SUBSTRING_INDEX(request, ‘”vendor”:{“name”:”‘, -1),'”,’,1) AS vendor_name_part
    , SUBSTRING_INDEX(SUBSTRING_INDEX(request, ‘”account_number”:”‘, -1),'”}’,1) AS account_number_part
    , request
    FROM call_logs
    WHERE request LIKE ‘%vendor%account_number%’;

  2. Update the data

    UPDATE call_logs
    SET request = REPLACE(request, SUBSTRING_INDEX(SUBSTRING_INDEX(request, ‘”vendor”:{“name”:”‘, -1),'”,’,1), ‘XXXXXXXX’),
    request = REPLACE(request, SUBSTRING_INDEX(SUBSTRING_INDEX(request, ‘”account_number”:”‘, -1),'”}’,1), ‘XXXXXXXX’)
    WHERE request LIKE ‘%vendor%account_number%’;

Before the update:

Screen Shot 2017-06-15 at 4.50.45 PM

After the update:

Screen Shot 2017-06-15 at 4.51.36 PM

Pivot (dynamically)!

(Do you have the scene from Friends where Ross tries to move the couch stuck in your head?  Because I do.)

Pivot is a handy tool in SQL Server for turning rows into columns, just like you would in Excel.  The downside is that it doesn’t accept in variables directly, but this can be managed using Dynamic SQL.

The old way.  (Note – using the AdventureWorksLT2012 schema)

Step 1: Find my pivot category list

SELECT DISTINCT ISNULL(color, 'Uncolored') FROM SalesLT.Product;

Screen Shot 2017-05-18 at 11.57.32 AM

Step 2: Paste in my list to my Pivot Statement

SELECT * FROM 
(SELECT P.productid, PC.Name, ISNULL(P.color, 'Uncolored') as Color
FROM SalesLT.ProductCategory as PC
JOIN SalesLT.Product as P
ON PC.ProductCategoryID = p.ProductCategoryID
) as PPC
PIVOT(COUNT(ProductID) FOR Color IN([Red],[Blue],[Black],[Silver],[Grey],[Multi],[Uncolored])) as colors
ORDER BY Name;

Screen Shot 2017-05-18 at 11.56.44 AM

While this works, if I have any new colors they are not automatically added to my list.  Using sp_executesql, I can pass in a group string to create my updated color list:

DECLARE @groupcolors nvarchar(4000)
DECLARE @Colors AS TABLE (Color nvarchar(15));

INSERT INTO @Colors
SELECT DISTINCT ISNULL(color, 'Uncolored') FROM SalesLT.Product;
SELECT @groupcolors = COALESCE(@groupcolors+',[' ,'[') + CONVERT(nvarchar(15), Color) + ']' from @Colors;
--SELECT @groupcolors;

DECLARE @SQLString AS NVARCHAR(4000)
SET @SQLString = N'
SELECT * FROM 
(SELECT P.productid, PC.Name, ISNULL(P.color, ''Uncolored'') as Color
FROM SalesLT.ProductCategory as PC
JOIN SalesLT.Product as P
ON PC.ProductCategoryID = p.ProductCategoryID
) as PPC
PIVOT(COUNT(ProductID) FOR Color IN (' + @groupcolors + ')) as Color
ORDER BY Name;'
EXEC sp_executesql 
 @statement = @SQLString
 , @params = N'@groupcolors NVARCHAR(4000)'
 , @groupcolors = @groupcolors;

Screen Shot 2017-05-18 at 11.58.40 AM


Deadlocks – Share the Road?

This past summer, when the vast majority of big application enhancements were in after our massive re-platforming project (SQL Server backend), we were able to get some of the Dev resources to start getting more attention on the day to day performance issues, including some frequent occurrences of deadlocks (a few more than I’d like to admit!) and some long running transactions.  While the application had to logic to retry the transaction and processing would continue, this is not something you want to have as a regular occurrence.

This has been an ongoing effort between dev & DBA, and we’ve used several different tools & methods to improve overall system performance:

  • Adding indexes
  • Adding indexes to temp tables within stored procedures
  • Converting large Entity Framework queries to stored procedures
  • Implementing a caching solution (Redis) for a portion of the application
  • Rewriting Stored Procedure & View logic to reflect usage patterns in the application.

With all the tuning we’ve done, we still have one stored procedure which is occasionally involved in deadlocks.  This stored procedure itself has had a lot of care and feeding, where I not only was able to leverage indexes on temp tables for performance but an application logic rewrite, which resulted in a 95% decrease in average time for this stored procedure.  Deadlocks reduced further, but still occurs when we hit a particular race condition.  This has become my white whale.

I was again inspired by Kendra Little’s Troubleshooting Blocking and Deadlocks for Beginners course on https://sqlworkbooks.com/ (and even if you are not a beginner,  I think she has a great way of looking at concepts that at least for me gives me a different perspective on approaching problems).  An example she gives about deadlocks is how it’s like two trucks going towards each other on a narrow road, there isn’t room to pass.  In her example, she created an alternative route for a read query to traverse that was being blocked by an update.

The trick on my deadlock was that it involved the primary key and the clustered key – which on this table happened to be two different keys.  My victim was consistently using the Primary key for the lookup but then needed to updated the Clustered Key.  My killer was using the Clustered Key for the lookup & update.  So my thought was can I tell my stored procedure to use the same path as the killer based on my knowledge of my data setup?  Share the road and drive in the same order?  (maybe it’s more like the circle driveway like you have at a hotel, where everyone should enter & exit the same way).

To visualize, here is an example table “OrderItems” to illustrate.  The yellow column, ItemId, is my Primary Key.  The red columns, OrderID & ItemNumber are my Clustered key, on which the table is organized.  In SQL Server, Clustered indexes sort and store the data rows in the table based on their key values (see MSDN Clustered and Nonclustered Indexes Described for more details). Generally the Clustered Index and Primary Key would be the same but in our application, we are referring to the Items in the context of the Orders.

Screen Shot 2017-03-17 at 2.01.28 PM

My “victim” example:

UPDATE OrderItems
SET cost = peritemcost
FROM orderItems oi JOIN #temprollup tr on oi.itemid = tr.itemid;

My Killer example:

UPDATE OrderItems
 SET ItemNumber = @ItemNumber, Cost=@Cost, Taxable= @Taxable, Quantity=@Quantity, ...
WHERE ItemID = @ItemID;

Why is my “Killer” using the Clustered key index vs. the primary key for lookup?  In this case, every column is potentially updated.  My victim uses the Primary key for its lookup.

In testing, adding the Clustered Key first column prompted my stored procedure to use the Clustered key for the lookup & update.

My “victim” update (one option – another would have been to keep the OrderID column in the temp table and include on the join, but this was the quickest to illustrate)

UPDATE OrderItems
SET cost = peritemcost
FROM orderItems oi JOIN #temprollup tr on oi.itemid = tr.itemid
WHERE OrderID = @OrderID;

While I need to do further testing & load testing, this looked to be a promising start!  (It also looked like my stored procedure change reduced that step from ~13 ms to ~5 ms, removed a work table and reduced my logical reads from 634 to 588 on my “OrderItems” table on my test set).

Capturing Blocking

Blocking in databases is a result of locks taken in the database in order to help maintain concurrency among multiple transactions, indicating transaction intent.  A potential side effect of these locks can be blocking (and in some cases deadlocks!), where transactions are waiting for other transactions to release a lock resource.  Often we can see this result in slower performance for users.  (some of this is affected by transaction isolation levels, which would be a whole different post).

Similar to capturing deadlocks & foreign key errors, blocking can be captured.  I think in this case SQL Server has the leg up on tools here.

MySQL

On the MySQL side, I look for long running transactions, not necessarily only blocking transactions.  Here I use the Percona Monitoring Plugin for Nagios, using pmp-check-mysql-innodb , checking for all three options idle_blocker_duration, waiter_count and max_duration.

SQL Server

I’d like to thank Kendra at sqlworkbooks.com for explaining the (native!) tools in SQL Server to capture blocking in her online training class Troubleshooting Blocking and Deadlocks for Beginners (free through Dec 2017, recommended!).

Unlike the xml_deadlock_report, the blocked_process_report does not appear to be captured by default in the system_health extended event.  Like deadlocks, a custom Extended Event can be created & enabled to capture blocked processes, choosing “blocked_process_report” from the event library under Select Events to capture.  Once a blocker is captured, you can doubleclick to open the report and view information on the resources affected & (partial) queries.

Additionally, there is a handy open source SQL Server Blocked Process Report Viewer that creates a stored procedure which creates the lead & blocker trees for viewing the blocked processes in an easier to read tree format based based on the blockers captured in the extended events session.

The extended event captures blocking sessions, but doesn’t notify on occurrence.  An SQL Server Agent alert condition can be setup for “@performance_condition=N’General Statistics|Processes blocked||>|0′” to notify when a blocking event has occurred.


Capturing Foreign Key Errors

Looking further into capturing certain error conditions such as yesterday’s Capturing Deadlocks post, next up was looking for foreign key errors.

MySQL

Similar to capturing Deadlocks in MySQL, the most recent foreign key error can be viewed in SHOW ENGINE INNODB STATUS.  Similarly, the Percona Toolkit can be used to capture & log the foreign key errors using pt-fk-error-logger.  The setup again is similar to capturing deadlocks.

  • Install the Percona toolkit using your standard process
  • For the initial setup, I create a new tools database & tools user for this setup
  • The below block will create the percona.deadlocks table if it does not exist, and run the logger in daemon mode, checking every 60 seconds.
    1. Additional options
      pt-fk-error-logger h=<hostname>,u=perconaadm,P=3306 --ask-pass --dest D=percona,t=foreign_key_errlog --daemonize --interval 60s
    • Additional options notes
      • –ask-pass will cause a prompt for the password to be entered twice, password will not be visible in the process list.
      • –run-time 5m – This will run the tool in Daemon mode for 5 minutes, then exit.
      • –create-dest-table is optional (if you’ve already created the table!)
  • I have scripted this out to check the daemon is running.

The logging of the error contains the timestamp of the error and the error message including the constraints violated and the failing statement.

 SQL Server

I was not able to find a corresponding automatic capture for foreign key errors, we rely on the application to catch the foreign key errors and log for further review.

Capturing Deadlocks

The last few months I’ve been taking a number of online & in person SQL Server training classes & meetups, living in New England there are several options within a couple of hours drive to attend SQL Saturdays.

Going over the training and some recent patching of my MySQL environment has reaffirmed a that there is overlap between SQL Server & MySQL, even if the tools may vary.  Capturing Deadlocks for example!

MySQL

On the MySQL side, the most recent deadlock can be viewed using SHOW ENGINE INNODB STATUS.  Downside is that depending on the volume of your deadlocks, that gives you no history.  To address this, I use a combination of tools from Percona:

  1. The Deadlock Logger from the Percona Toolkit to capture deadlocks on a regular basis and log them to a table within my database.
    • Install the toolkit using your standard process
    • For the initial setup, I create a new tools database & tools user for this setup
    • The below block will create the percona.deadlocks table if it does not exist, and run the logger in daemon mode, checking every 60 seconds.
      pt-deadlock-logger h=<hostname>,u=perconaadm --ask-pass --dest D=percona,t=deadlocks  --create-dest-table --daemonize --interval 60s
      • Additional options notes
        • –ask-pass will cause a prompt for the password to be entered twice, password will not be visible in process list.
        • –run-time 5m – This will run the tool in Daemon mode for 5 minutes, then exit.
        • –create-dest-table is optional (if you’ve already created the table!)
    • I have scripted this out to check the daemon is running.
  2. The pmp-check-mysql-deadlocks Nagios plugin from Percona Monitoring Plugins to send the team a Nagios alert if a deadlock occurs.
    • Install the plugins using your standard process
    • We have an additional user created with permissions to read the deadlocks table
    • Configure check in Nagios

SQL Server

On the SQL Server side, deadlocks (xml_deadlock_report) may be captured in the Extended Events system_health session(2012+), but depending on the volume of events, these could be overwritten.  An extended event specific to capture xml_deadlock_report specifically can be created to have a longer history.

View Deadlocks under system_health:

  1. In SQL Server Management Studio, expand Management –> Extended Events –> Sessions –> system_health.
  2. Right click on package0.event_file, choose “View Target Data…”
  3. Click “Filters” on the Extended Events toolbar, and filter for:
    1. Field: Name, Value: xml_deadlock_report
    2. Click OK to apply filter
    3. DeadlockGraphFilter
  4. The deadlock graph is viewable under the Deadlock tab: DeadlockGraphexample.png

A SQL Server Agent alert could be considered to enabled alerts when deadlock thresholds are met (@performance_condition=N’Locks|Number of Deadlocks/sec|Database|>|0′), but we use an outside monitoring tool for our notifications.


Group & Count Objects by Day – Mongo

As a SQL DBA, I have some common queries I use to get by certain information, organized by date. I’m starting to do a bit more work with Mongo, and it can be a bit frustrating trying to translate what I can do with SQL into Mongo.

Here is one I figured out recently, I thought it may be useful for others. I want to get a count of items for a certain period of time, grouped & ordered by date.

Take this example in MySQL:

  • I’m formatting the CreationDate in the select, which will be used by the Grouping & Ordering. This parses out the additional date fields that would affect the group by (e.g. 7/1/15 10:51 and 7/1/15 11:51 can now be grouped)
  • Count: This is the data to be grouped by date
  • Where clause: Just get me the date since 7/1/15
  • Group by: Use the OrderDate for grouping
  • Order By: Use the OrderDate for ordering, use Ascending order (can use DESC for reverse order)

SELECT DATE_FORMAT(creationdate, '%m-%d-%y') AS 'OrderDate',
COUNT(DISTINCT O.ORDER_ID) AS OrderCount,
COUNT(OL.ORDERLINE_ID) AS 'OrderLines'
FROM ORDERLINE OL
JOIN ORDER O ON OL.ORDERID = O.ORDER_ID
WHERE O.creationdate > '2015-07-01'
AND O.DELETED = 0
AND OL.DELETED = 0
GROUP BY OrderDate
ORDER BY OrderDate ASC

Sample Data:

OrderDate OrderCount OrderLines
7/1/15 163 12553
7/2/15 160 16981
7/3/15 18 1194
7/5/15 7 2488
7/6/15 176 13328
7/7/15 148 13586
7/8/15 186 12795
7/9/15 143 17210
7/10/15 84 7088

On Mongo, I can do something similar – In this instance I’m counting the documents, but there are additional functions to sum/avg/count etc date within documents.

  • Match: In the aggregate, it’s like the Where clause: just get me the documents since 7/1/15
  • Group: This is where I’m defining the grouping criteria.  There is probably a prettier way to do this, but I’m breaking out the Year, Month & Day for each timestamp, similar to where it’s seen in the SQL Select portion.
  • Count: the data I’m grouping by date
  • Sort: Order by the _id group, 1 is ascending order, -1 is descending order.

db.Orders.aggregate(
[
{ $match :
{ timestamp :{ $gt: ISODate("2015-07-01T00:00:00.000Z")}}
},
{ $group : {
_id : { year: { $year: "$timestamp" } , month: { $month: "$timestamp" }, day: { $dayOfMonth: "$timestamp" }},
count: { $sum: 1 }
}
},
{ $sort: { _id: 1 } }
]
)

Sample data:

{ "_id" : { "year" : 2015, "month" : 7, "day" : 1 }, "count" : 956 }
{ "_id" : { "year" : 2015, "month" : 7, "day" : 2 }, "count" : 107 }
{ "_id" : { "year" : 2015, "month" : 7, "day" : 3 }, "count" : 73 }
{ "_id" : { "year" : 2015, "month" : 7, "day" : 4 }, "count" : 73 }
{ "_id" : { "year" : 2015, "month" : 7, "day" : 5 }, "count" : 73 }
{ "_id" : { "year" : 2015, "month" : 7, "day" : 6 }, "count" : 6385 }
{ "_id" : { "year" : 2015, "month" : 7, "day" : 7 }, "count" : 106 }
{ "_id" : { "year" : 2015, "month" : 7, "day" : 8 }, "count" : 3 }
{ "_id" : { "year" : 2015, "month" : 7, "day" : 9 }, "count" : 2 }

Configuring a Database with Transparent Database Encryption & Availability Groups

From what I’ve seen, Transparent Data Encryption (TDE) for SQL Server isn’t as heavily used a feature as many of the HA/DR options, but if your company has a requirement for encryption at rest, it’s a great feature to be able to access out of the box. On the MySQL side, I had done extensive testing with Gazzang, this was managed at the OS level, versus TDE at the database level.

Some things to note with TDE in SQL Server:

  • Requires SQL Server Enterprise Edition
  • There is some overhead, approx 3-5% (I need to run performance tests to validate this, but this is what I’ve read)
  • Any server where the database will be restored (either as a replica, or a standalone copy), will require the certificate restore & the Enterprise version of SQL Server
  • If the certificate for the database is lost, the database is not recoverable
  • Backup compression is not supported with TDE databases
  • Your tempdb database will also automatically be encrypted if any databases on an instance are encrypted.
  • You cannot add a TDE database to an availability group via the GUI, it must be added via T-SQL

Continue reading

SQL Server Replication – Recovering from a Network Outage

In continuing my on-going issues with SQL Server replication the past couple of weeks, we had a data center outage on Monday, which resulted in a forced failover to our DR data center.  Our MySQL database applications successfully failed over and required no followup.  We did run into 1 peer-to-peer row conflict, which I was able to address, similar to the issue late last week I documented here.

Things looked to be  running along fine, and I could see that my DR database was up to date with my production database.  My monitoring system was showing some undistributed transactions, but nothing that seemed too outrageous.  But I was continuing to get a few Network error notifications, which lead me to look at the SQL Server Replication Monitor.  Everything was green, but my undistributed transactions were showing well over an hour.

Continue reading

Becoming a “DevOps” DBA

I went to my first SQL Saturday this past weekend up in Maine, the first session I attended was on Best Practices for database deployments, it got me thinking about transitioning from more of a Production Support DBA in an IT organization to the DevOps DBA in an Engineering role I’ve take up over the past few years, though I don’t think the differences are quite as big as some may think.  For one, the production support aspect never goes away, though a lot of that may be from working with small to mid-size companies.  I’m still on call, things still need to be up & running.

The biggest change for me seems more around the size of the changes coming in, being in an Agile environment drives much of this, but also being part of an engineering environment versus implementing off the shelf applications from outside vendors.  There is still a review on what changes are coming in, but in the IT organization, these were managed as projects, and some applications may go years between vendor updates.  Depending on the application there can be a massive amount of schema/data changes, often times this was a negotiated downtime event, coordinating the app & database updates.  Depends on the application.

In this agile setup, many of the database changes are fairly small & straightforward to review, sometimes a simple as adding a single column, index etc.  Since it’s an internal development, we can mandate that all changes are backwards compatible, so that database changes can be deployed independently of the application change, giving us time to “bake in” the change, make sure there are no negative impacts.  These database changes happen up to a few times a week, depending on the component being deployed.  They are uptime changes for the most part, often during business hours – +1 for minimizing weekend work.

Database tuning is a necessity on both sides, though larger vendors may have configuration setting recommendations required.  When SQL tuning, often the only option I had was to add indexes (outside of additional tuning on the instance configurations).  With an internal development team, there is some more flexibility (To a degree – when devs use ORMs like Hibernate or Active Record, adding indexes is still more straightforward for SQL tuning – but SQL can be rewritten in a better manner than created by the tools, but you lose some of the benefit of using the tool for managing your code in the first place).  But there is more of an opportunity to address sql rewrites for performance tuning in house, versus working with an external vendor to address their code.